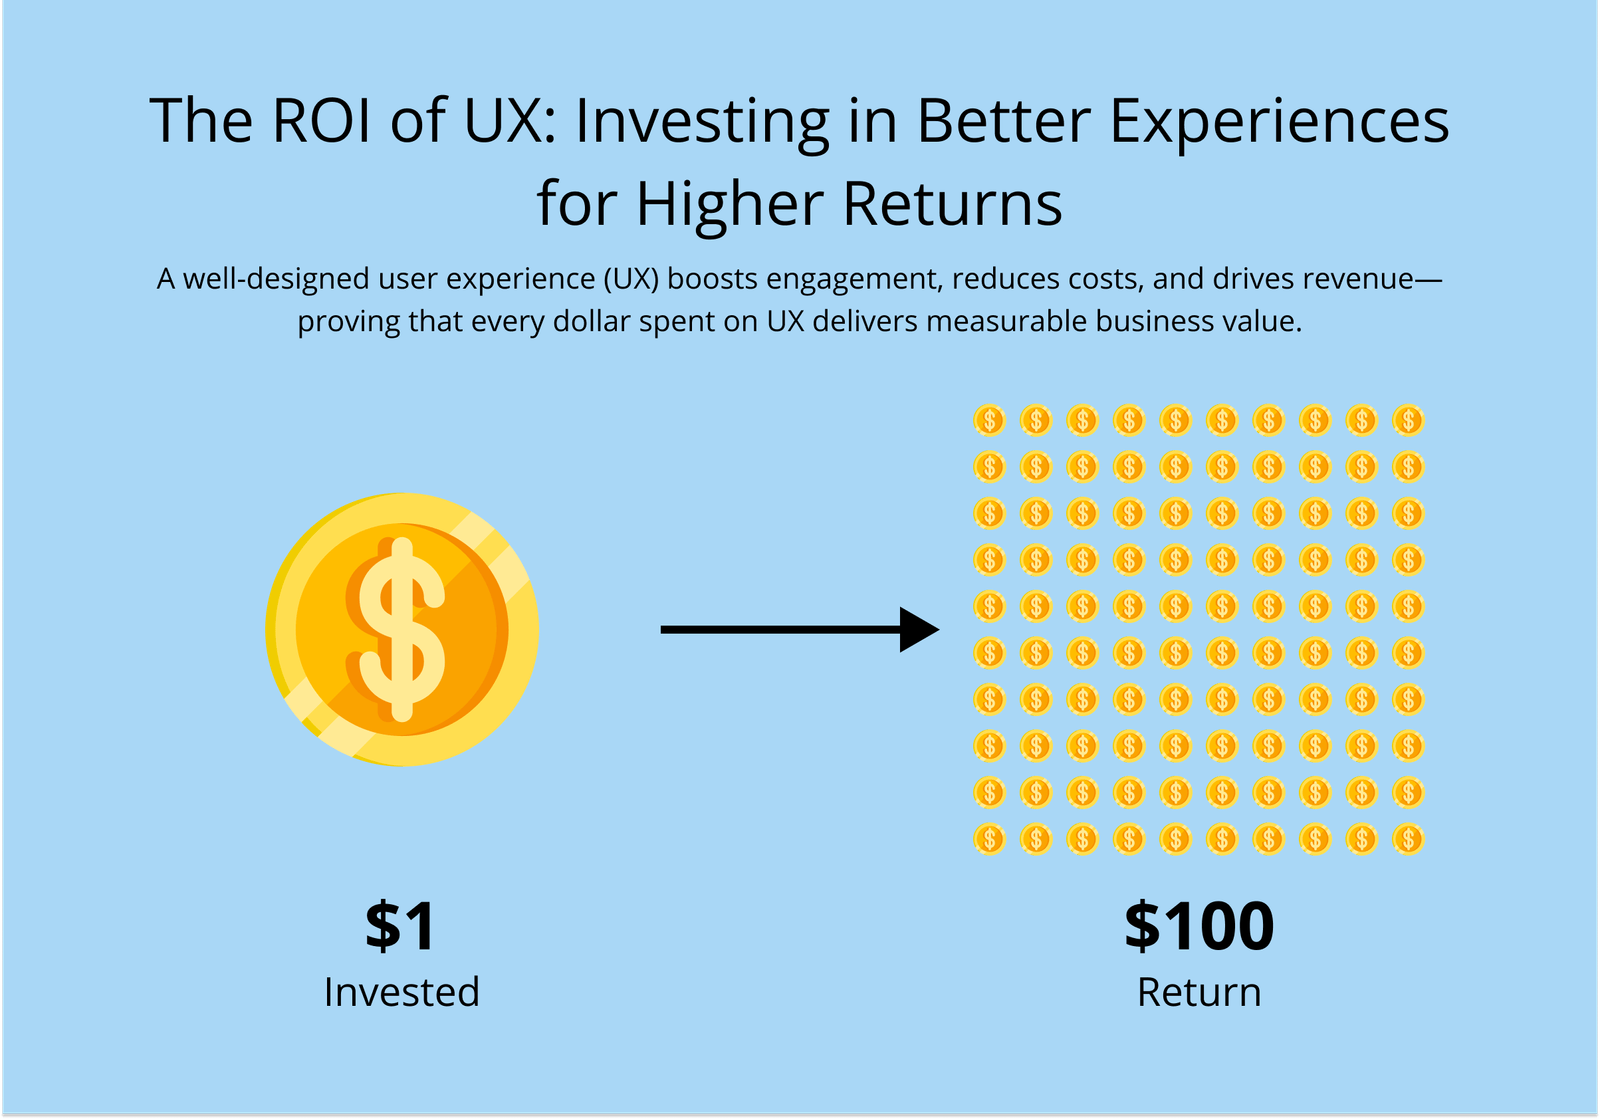
Every $1 invested in UX metrics returns up to $100 in ROI
This staggering figure isn’t just impressive—it represents a fundamental truth we’ve observed repeatedly: great design directly impacts your bottom line.
Companies prioritizing design experience 32% higher revenue growth and 56% higher total returns to shareholders compared to their competitors. We’ve seen firsthand how tracking the right ux success metrics transforms business outcomes. In fact, organizations enhancing their UX experience a 14.4% increase in customers’ willingness to pay, reduce the probability of customers switching brands by 15.8%, and are 16.6% more likely to receive customer referrals. However, many businesses still struggle to connect their ux metrics to measure success with actual financial outcomes. That’s why understanding outcome driven ux metrics is crucial—especially when nearly 88% of online consumers say they won’t return after a bad user experience[-5].
In this article, we’ll break down exactly how to measure, calculate, and communicate the ROI of your UX investment. Additionally, we’ll explore the essential ux metrics and KPIs that drive business growth and help you align your design strategy with measurable business objectives.
What is UX ROI and Why It Matters?
Understanding what UX ROI really means and why it matters can fundamentally change how you approach design investments. UX ROI represents the quantifiable return a business gains from investing in user experience enhancements. It connects design efforts directly to business outcomes such as increased sales, improved customer satisfaction, and operational savings.
Understanding ROI in the context of UX
ROI of Great Design goes beyond simple financial calculations—it measures how design improvements affect your bottom line. According to research, every INR 84.38 invested in UX design can deliver an impressive INR 8438.05 return, representing a staggering 9,900% ROI. This remarkable figure demonstrates why businesses increasingly view UX as a critical investment rather than an optional expense.
Calculating UX ROI involves determining how design changes impact business goals—whether that’s revenue growth, cost savings, or other key performance indicators (KPIs). This calculation serves as a powerful tool for building organizational buy-in, demonstrating that good UX doesn’t just benefit users—it significantly benefits the business as well.
How UX impacts business outcomes?
Strategic UX design directly influences several critical business metrics:
- Revenue Growth: Well-designed UX can increase a website’s conversion rate by up to 200%, driving substantial revenue increases through higher purchase frequency and improved conversion rates.
- Cost Reduction: Thoughtful UX design minimizes expensive back-and-forth fixes later in development, consequently reducing support costs as users encounter fewer problems.
- Customer Loyalty: Enhanced user experiences boost customer satisfaction, reducing the probability of users switching brands by 15.8%.
- Market Differentiation: Effective UX helps businesses stand apart from competitors who neglect this crucial aspect, giving them a competitive edge in attracting and retaining customers.
Neglecting UX design can have serious financial consequences. Companies lose approximately INR 219.39 billion annually due to sluggish website loading times alone. Furthermore, AWS research reveals that poor user experiences could cause businesses to lose up to 35% of potential sales.
The difference between UX ROI and traditional ROI
Traditional ROI calculations primarily focus on profit margins or cost savings, whereas UX ROI incorporates psychological and behavioral user responses. For this reason, UX ROI considers how design affects user behavior, reduces friction, and increases satisfaction—all factors leading to higher engagement, retention, and conversions.
Unlike traditional ROI measurements that might not capture subtle benefits, UX ROI specifically accounts for the human factor and real-world impact of design on user performance and business outcomes. UX-oriented businesses experience massive advantages in customer loyalty and advocacy that extend beyond immediate financial returns.
UX ROI calculations don’t always need to be exhaustively detailed. As experts note, these estimates should be “as accurate and realistic as reasonably possible”, but should only be as comprehensive as necessary to convince stakeholders of design’s value.
How to Calculate the ROI of UX Design?
Turning UX improvements into measurable financial outcomes requires a systematic approach. Many organizations overlook calculating design ROI primarily because of anxieties about performing these calculations. Nevertheless, following a structured process makes it entirely achievable.
Step 1:
Define the business problem
Initially, identify the specific problem your UX improvements aim to solve. What’s inefficient or frustrating for users? Which aspects cost your organization money or resources? Focus on pain points that directly impact business metrics—whether that’s low conversion rates, excessive support tickets, or high abandonment rates. For instance, if users struggle with a file export workflow, document the current issues thoroughly. Essentially, this foundation ensures your UX metrics align with genuine business challenges.
Step 2:
Set baseline UX metrics
Before implementing changes, collect data to establish your starting point. This benchmarking study provides the “before” picture necessary for measuring improvement. Select appropriate ux metrics to measure success based on your identified problem—task completion rates, time-on-task, error rates, or customer satisfaction scores. For internal applications, you might measure how long employees take to complete specific tasks. These baseline ux metrics for businesses become your comparison standard for calculating improvements.
Step 3:
Forecast improvements
Subsequently, set clear, measurable goals for your UX project that reflect both user-centered improvements and business outcomes. Use data from research, competitor benchmarks, or past projects to make realistic projections about potential gains. For example, you might forecast a 15% reduction in support calls or a 20% increase in feature adoption. These forecasts help establish expectations and guide your UX strategy.
Step 4:
Use the ROI formula
The standard ROI formula applies to UX work: ROI = (gain from investment – cost of investment) / cost of investment. For UX projects, the “gain” represents the financial benefit of your improvements, while “cost” includes all project expenses. If redesigning an internal application saves employee time, multiply time saved by average hourly pay, number of employees, and task frequency. Although these calculations are estimates, they provide valuable perspective on the potential value of your UX investment.
Step 5:
Communicate results to stakeholders
Finally, present your ROI findings to stakeholders in a transparent, compelling manner. Focus on metrics that align with stakeholders’ priorities, typically financial outcomes. Include important details about your methodology: “We observed a reduction in support tickets by 21,900. Assuming each ticket costs INR 506.28, that’s a projected savings of INR 11,087,591.24 in one year”. Remember that while ROI calculations are strategic tools for conceptualizing value, they aren’t exact financial projections. Always explain your assumptions and calculation methods to build credibility with stakeholders.
Key UX Metrics That Drive ROI
Measuring the right UX metrics lets you quantify design’s impact on your bottom line. Tracking these key performance indicators reveals exactly how user experience drives financial returns and business growth.
Task completion rate and time-on-task
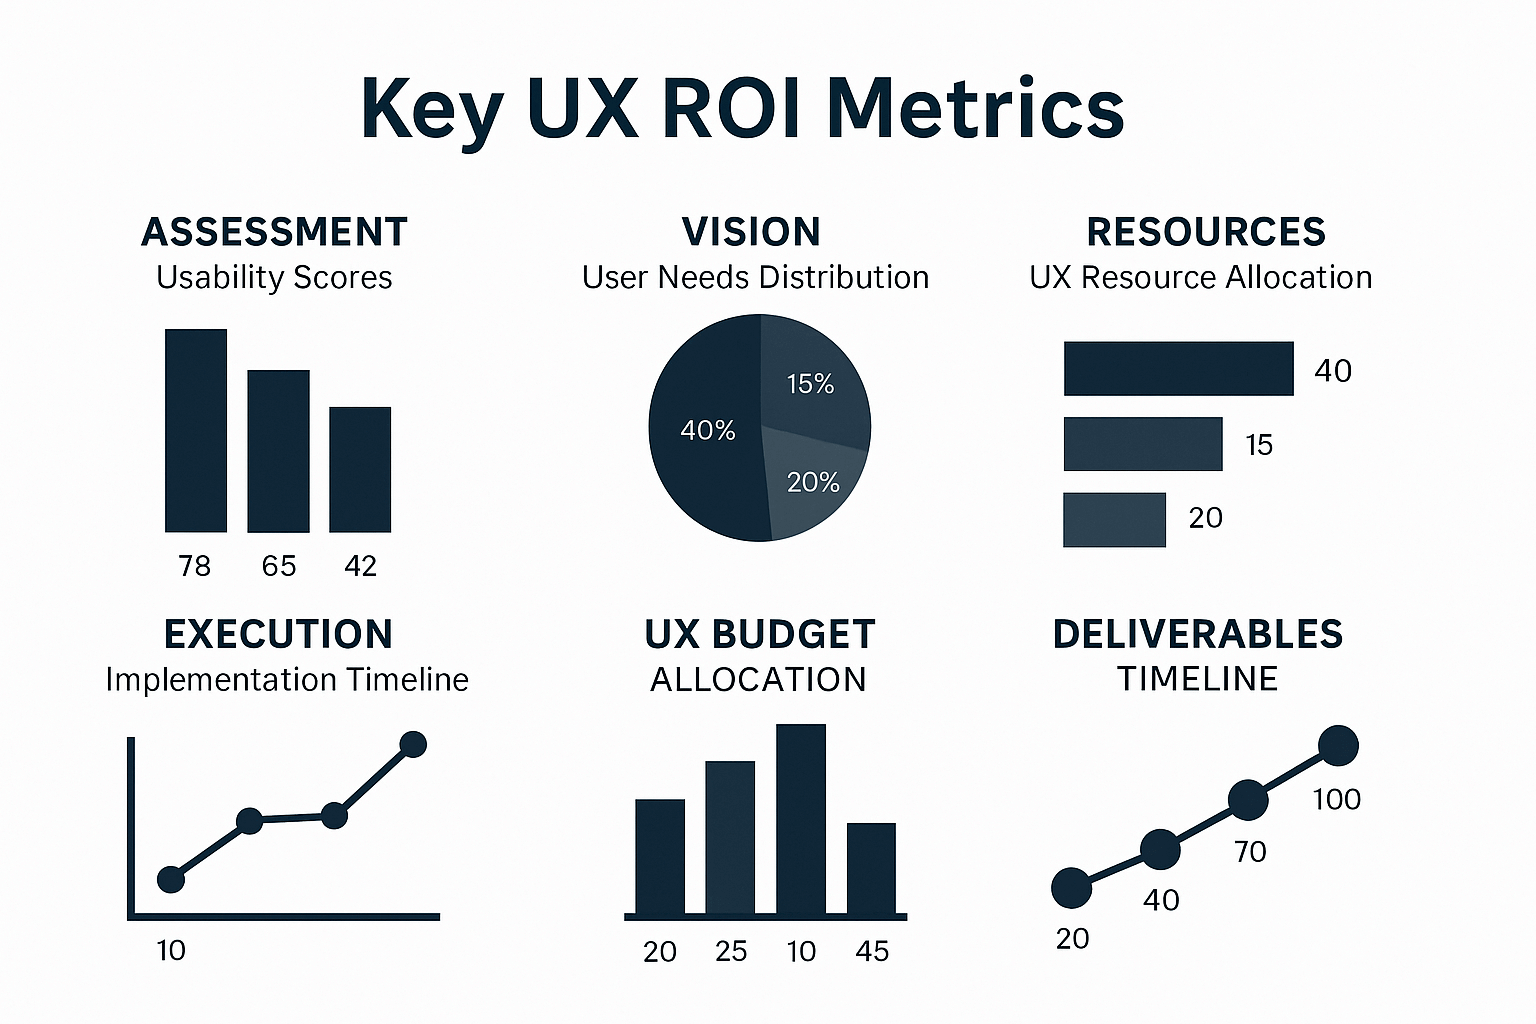
Task completion rate measures the percentage of users who successfully accomplish a specific goal in your product. With an average success rate benchmark of 78% across industries, this metric directly correlates with increased conversions and revenue. Moreover, time-on-task evaluates how quickly users complete activities, serving as a critical efficiency measure for your UX. Shorter completion times generally indicate more intuitive designs, leading to higher user satisfaction and retention.
Error rate and usability issues
User error rate reveals how often people make mistakes while interacting with your interface. This metric identifies points of friction that potentially drive away customers and increase support costs. Indeed, high error rates strongly correlate with serious usability problems. By tracking both error occurrence and severity, you gain insight into which design flaws most urgently need fixing to improve conversion rates.
Customer satisfaction (CSAT, NPS)
Customer Satisfaction Score (CSAT) measures user satisfaction with specific aspects of your product, likewise, Net Promoter Score (NPS) quantifies how likely customers are to recommend your offering. Both metrics provide valuable insight into customer loyalty and sentiment. Research shows NPS closely relates to user experience perception, making it a powerful indicator of how UX improvements affect customer retention and word-of-mouth marketing.
Support ticket volume and AHT
Support ticket volume directly reflects how intuitive your product is. Simultaneously tracking Average Handle Time (AHT) – typically around six minutes for well-designed experiences – reveals the efficiency of your customer service operations. Primarily, these metrics translate to tangible cost savings, as optimizing UX can significantly reduce support overhead and associated expenses.
UX metrics and KPIs to track over time
Longitudinal measurement of UX metrics enables you to demonstrate ongoing ROI from design investments. Notably, combining multiple metrics into a Single Usability Metric (SUM) creates a comprehensive picture of your product’s usability. The most effective approach involves balancing quantitative data with qualitative insights to guide strategic design decisions that enhance business performance over time.
Real-World Examples of UX ROI in Action
Real case studies offer compelling proof that strategic UX improvements directly impact revenue and growth. These examples showcase exactly how companies translated user-centric design into measurable business outcomes.
Case 1:
$300M revenue from a button change
A major e-commerce site discovered a single form was preventing customers from completing purchases, costing them millions annually. The culprit? A mandatory registration process during checkout that frustrated users. During usability testing, shoppers revealed they resented being forced to register: “I’m not here to enter into a relationship. I just want to buy something”.
The solution was remarkably simple—replacing the “Register” button with a “Continue” button and adding reassuring text: “You do not need to create an account to make purchases on our site”. Upon implementation, purchases increased by 45%, generating an extra INR 1265.71 million in the first month alone. Over the year, this minor UX change yielded an additional INR 25314.14 million.
Case 2:
HubSpot’s redesign and retention boost
When HubSpot tackled their record page redesign, they identified that excessive usage patterns were slowing down sales and support workflows. Through comprehensive usability testing of nearly 40 activity types, they uncovered significant issues including unresponsiveness and limited functionality that had caused an 11% decline in users.
The team eliminated unnecessary white space, reduced load time, and simplified data scanning actions. Primarily focusing on user metrics, they decreased the average 8-minute email response time. Their outcome-driven approach paid off—conversion rates doubled and even tripled in some areas. Overall revenue grew by 33% to INR 146.06 billion compared to previous year.
Case 3:
SEOcrawl’s 2X growth after UX overhaul
SEOcrawl partnered with design agency Eleken to revamp their platform that had been operating for six months. The company aimed to expand functionality while overcoming their outdated interface with only an inexperienced trainee designer on staff.
Throughout the four-month redesign process, every decision was guided by user feedback. The redesign included creating new tools: the Crawler for detailed SEO analysis and the SEO Monitor for identifying problem areas. As a result, SEOcrawl doubled its user base and gained new paid customers.
Best Practices for Maximizing UX ROI
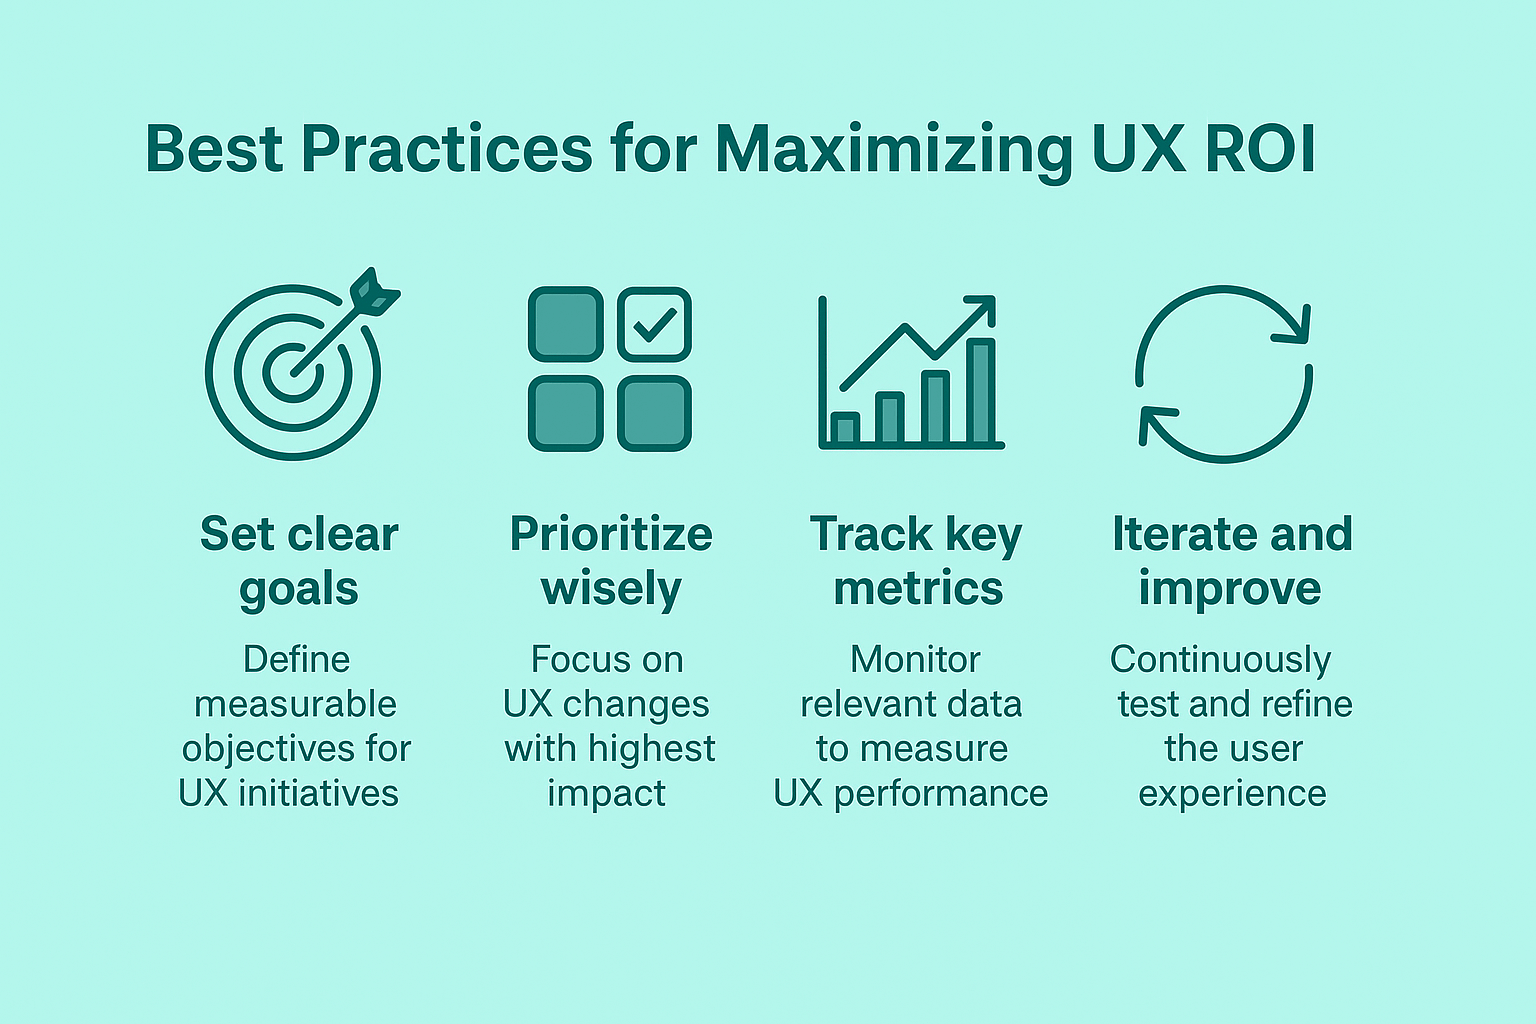
To maximize the return on your UX investments, implementing proven strategies is vital. Research shows that every dollar invested in UX can yield up to 9,900% in returns, making these best practices essential for business success.
Start with user research and testing
User testing should ideally occur throughout each phase of ideation and prototyping, gathering fresh insights with every change to your product or website. First and foremost, balance regular testing with available resources to maintain a practical schedule while still enabling informed decisions. Even small, focused studies can demonstrate value to stakeholders and build a case for ongoing UX investment.
Integrate UX across the product lifecycle
Good UX design keeps the customer at the center from research through launch. Primarily, this approach increases sales, user engagement, and adoption rates while strengthening customers’ emotional connection to your product. Comprehensive UX research throughout the development process helps mitigate risks and avoid costly mistakes.
Set realistic ROI goals and benchmarks
Establishing both short-term and long-term ROI objectives helps monitor effectiveness. Hence, realistic goals allow teams to track progress and make adjustments when necessary. Sound benchmarking practices let your organization measure UX performance against industry standards.
Use UX metrics and KPIs to guide decisions
UX performance indicators help quantify and calculate the ROI of changes that would otherwise be impossible to measure. Consider monitoring Core Web Vitals defined by Google alongside customer engagement metrics to drive conversions and profitability.
Continuously iterate based on feedback
The iterative design process involves continuous refinement based on user feedback and testing outcomes. Undoubtedly, iteration is essential for developing designs that remain relevant in a constantly changing digital landscape. Research shows redesigning interfaces based on user testing can improve overall usability by 165% from first to last iteration.
Aligning UX Strategy with Business Goals
Strategic alignment between UX design and business objectives creates exceptional value for both users and organizations. Creating this alignment requires deliberate effort across multiple fronts.
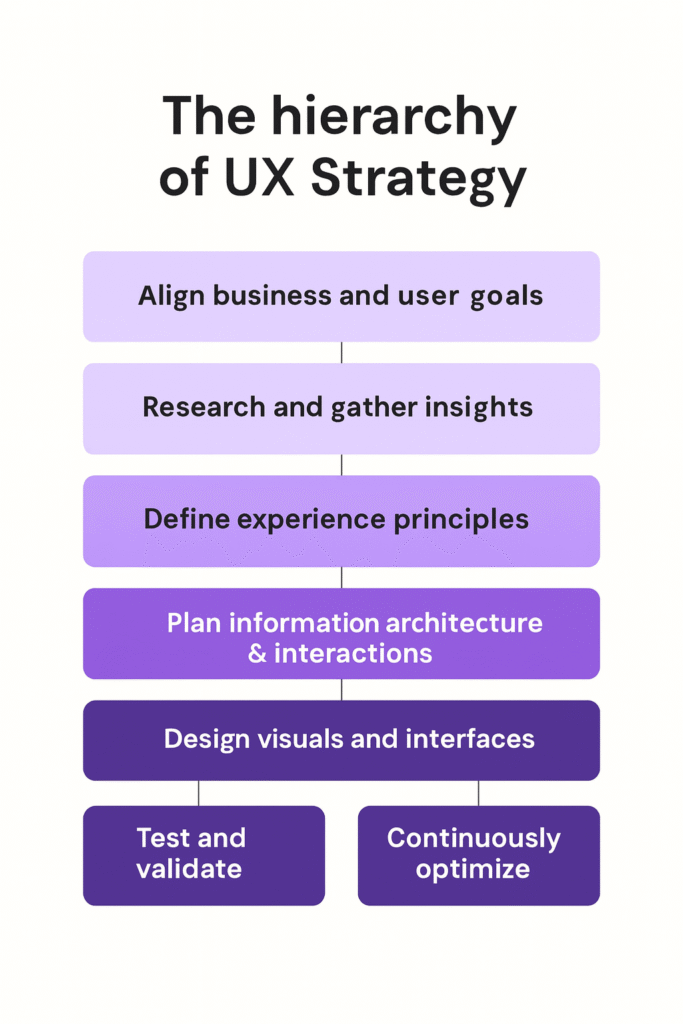
Involving stakeholders early
Bringing stakeholders into the UX process from the beginning ensures research relevance and secures necessary support for implementation. One-on-one interviews with key stakeholders help designers understand their perspectives while simultaneously building investment in UX outcomes. This collaborative approach creates co-ownership of research findings, making stakeholders more likely to champion design changes.
Mapping UX outcomes to business KPIs
Your UX metrics must directly connect with business KPIs to demonstrate tangible value. By documenting business outcomes in concrete terms—such as “increase customer retention by 10%” or “reduce support tickets by 25%”—UX teams can align their goals with organizational priorities. This translation helps trace all UX contributions across the organization.
Balancing user needs with company objectives
Finding harmony between user satisfaction and business requirements remains an ongoing challenge. Yet, when user needs are prioritized effectively, business needs typically follow. The ideal approach involves viewing the product holistically through collaboration with diverse teams.
Using outcome driven UX metrics for planning
Outcome-driven UX metrics answer a fundamental question: “How will you improve your users’ and customers’ lives?”. These metrics help teams stay focused on the same goals while moving beyond measuring mere outputs. Through specialized UX outcome workshops, teams can pinpoint specific improvements that matter to both users and the business.
Conclusion
Strategic UX design stands as a pivotal investment rather than an optional expense. Throughout this article, we’ve seen how thoughtful user experience directly translates to measurable business outcomes. The evidence speaks for itself – companies prioritizing design experience 32% higher revenue growth and significantly stronger shareholder returns compared to competitors.
Calculating UX ROI might seem daunting at first, but following the structured approach we outlined makes this process straightforward and valuable. Task completion rates, error metrics, customer satisfaction scores, and support ticket volumes all provide concrete data points that connect design decisions to financial outcomes.
Real-world case studies undoubtedly reinforce this connection. HubSpot’s record page redesign boosted their revenue by 33%, while a simple button change for an e-commerce site generated millions in additional revenue. These examples demonstrate why understanding and measuring UX ROI matters so much.
Success ultimately comes from aligning your UX strategy with broader business objectives. Early stakeholder involvement, mapping UX outcomes to business KPIs, and balancing user needs with company goals create the foundation for exceptional results. User-centered design doesn’t just benefit customers – it directly enhances your bottom line.
We believe great UX represents one of the smartest investments your company can make today. The question shifts from whether you can afford to invest in UX to whether you can afford not to. Accordingly, companies that embrace strategic design thinking and consistently measure its impact will find themselves with happier customers, reduced costs, and stronger financial performance for years to come.
Key Takeaways
Strategic UX design delivers exceptional financial returns, with every $1 invested potentially yielding up to $100 in ROI while driving measurable business growth.
• UX investment generates massive returns: Every dollar spent on UX can deliver up to 9,900% ROI, with design-focused companies experiencing 32% higher revenue growth.
• Calculate ROI systematically: Define business problems, set baseline metrics, forecast improvements, apply ROI formulas, and communicate results to stakeholders effectively.
• Track metrics that matter: Monitor task completion rates, error rates, customer satisfaction scores, and support ticket volumes to quantify UX impact on business outcomes.
• Small changes create big results: Simple UX improvements like button text changes can generate millions in additional revenue, as demonstrated by real-world case studies.
• Align UX with business goals: Involve stakeholders early, map UX outcomes to business KPIs, and use outcome-driven metrics to ensure design decisions support organizational objectives.
The evidence is clear: companies that prioritize strategic UX design don’t just create better user experiences—they build stronger, more profitable businesses. When UX strategy aligns with business objectives and success is measured through concrete metrics, the return on investment becomes undeniable.
FAQs
Q1. How does UX design impact a company’s bottom line?
UX design directly affects revenue growth, cost reduction, and customer loyalty. Companies prioritizing design experience 32% higher revenue growth and 56% higher total returns to shareholders compared to competitors. Well-designed UX can increase website conversion rates by up to 200% and reduce the probability of customers switching brands by 15.8%.
Q2. What are some key metrics to measure UX ROI?
Important UX metrics include task completion rate, time-on-task, error rate, customer satisfaction scores (CSAT and NPS), and support ticket volume. These metrics help quantify how design improvements impact user behavior, satisfaction, and ultimately, business outcomes.
Q3. Can you provide an example of how a small UX change led to significant ROI?
A major e-commerce site changed a single button from “Register” to “Continue” and added reassuring text about not needing to create an account. This minor UX improvement resulted in a 45% increase in purchases, generating an extra $300 million in revenue over a year.
Q4. How can companies align their UX strategy with business goals?
To align UX strategy with business goals, companies should involve stakeholders early in the design process, map UX outcomes to specific business KPIs, balance user needs with company objectives, and use outcome-driven UX metrics for planning. This approach ensures that UX efforts directly contribute to organizational priorities.
Q5. What’s the recommended approach for calculating UX ROI?
To calculate UX ROI, follow these steps: 1) Define the business problem, 2) Set baseline UX metrics, 3) Forecast improvements, 4) Use the ROI formula (ROI = (gain from investment – cost of investment) / cost of investment), and 5) Communicate results to stakeholders. This systematic approach helps quantify the financial impact of UX investments.
